Legacies- where do offspring fall? Italian Greyhounds
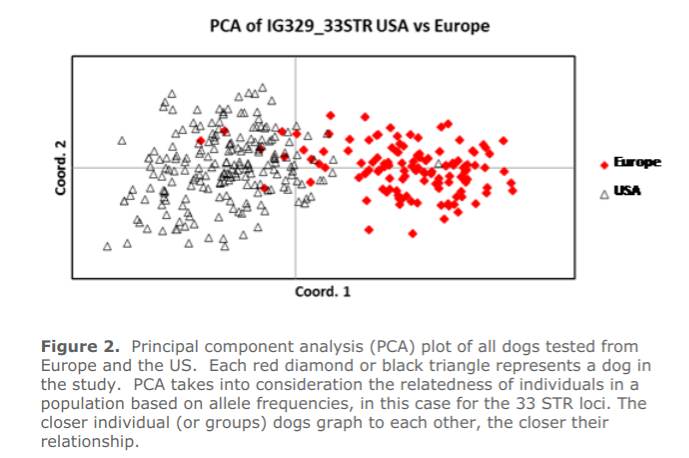
As of the date of this publication, 579 Italian Greyhounds have been tested at UC Davis, with another 40 ordered! Italian Greyhounds were one of the first breeds to receive their diversity report from UC Davis. Interestingly, there is a breed split based on geography. Meaning? Italian Greyhounds in Europe are different from Italian Greyhounds found in the United States. This is not true in all breeds. Italian Greyhounds as a breed have retained a moderate amount of diversity, however it is less well distributed in terms of effective alleles per locus compared to some breeds, though better in comparison to others. If American and European Italian Greyhounds were separated into two distinct gene pools, or varieties, the amount of biodiversity in each would be far less in each. The study found that homozygosity in the DLA was associated with increased risk for autoimmune disease. You can read the study published on Italian Greyhounds here. From the UC Davis breed report, “The breed appears to have reasonable breed-wide diversity, but this diversity is very unbalanced. As a result of genetic bottlenecks and potential popular sire effects, a majority of IGs are relatively inbred and contain a minority of the existing genetic diversity.” The study found that American Italian Greyhounds tended to be more inbred than European Italian Greyhounds, with American having slightly more overall biodiversity than European Italian Greyhounds.
The Parents
Obviously, selection for breeding mates involves more than genetic diversity. We also want the type, temperament, drive, pedigree, etc. in our resultant puppies, just as we always have before.
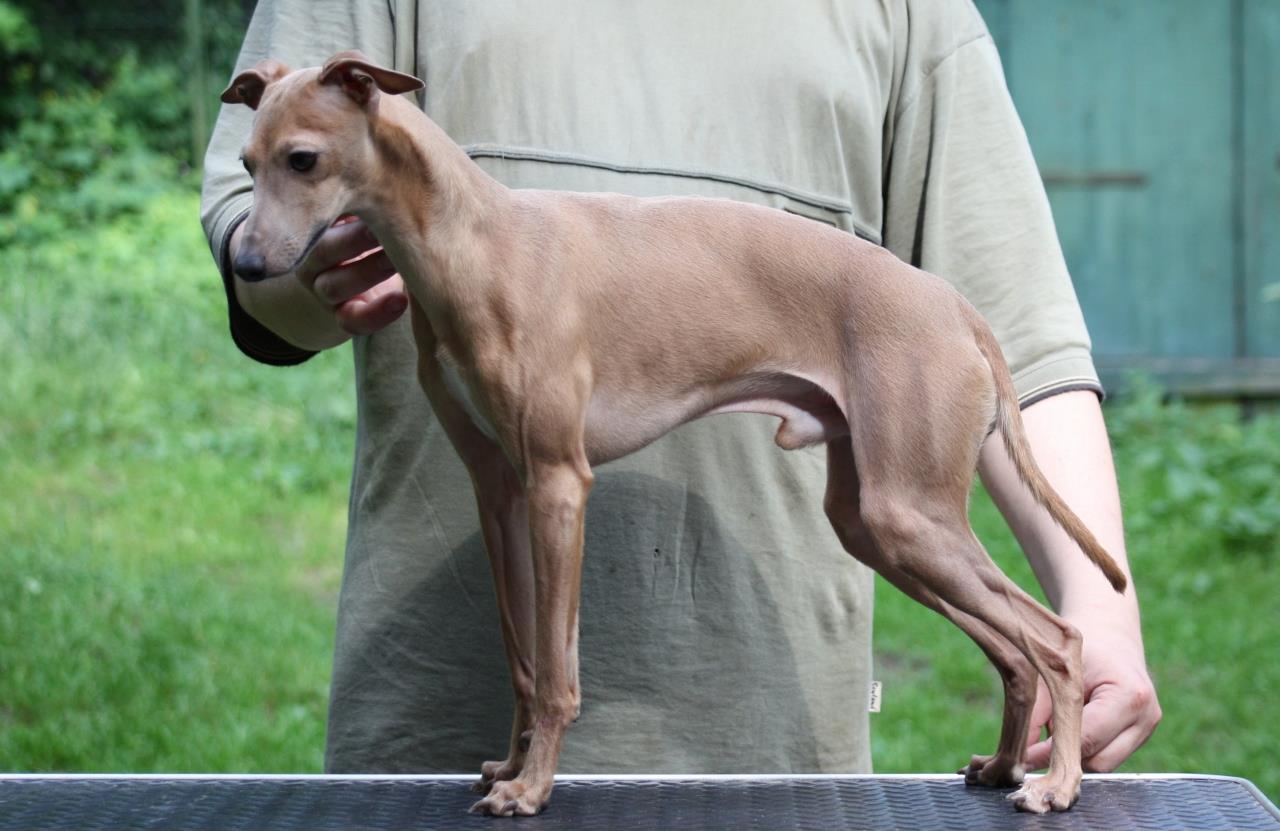
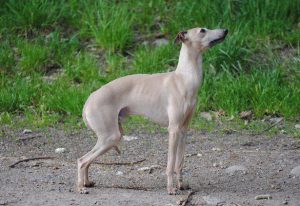
This is the sire. Let’s look at the key points:
The DLA: One of his DLA haplotypes, 1044/2034, is the most common combination for the breed, while the other is a more neutral haplotype (but well represented and found in ~10% of the tested alleles), 1040/2039. These haplotypes represent large sections of DNA, and will stay the same from generation to generation as they are inherited as a set.
While Italian Greyhounds have retained a remarkable amount of diversity in the DLA, there are many haplotypes that are very scarce and could be easily lost to genetic drift. According to UC Davis, the most common DLA haplotypes in Class I are 1008 (13.49% of the tested alleles), 1044 (24.86% of the tested alleles), and 1052 (19.07% of the tested alleles), and in Class II, 2017 (21.89% of the tested alleles) and 2034 (24.86% of the tested alleles). The rest of the DLA haplotypes are either relatively well distributed or very uncommon.
Outlier Index (OI): His OI is well above breed average. He is from Poland, which may mean his lines are unique in comparison to the rest of the tested population. As this number drops, a breed is breeding toward a genetic bottleneck, which is when the genes of a few ancestors become very common in the majority of a population. The average OI of this breed is at a relatively good level at .29, so breeders with individual dogs that have lower than breed average OI can easily raise them in their puppies by looking for mates with higher OI.
Average Genetic Relatedness (AGR): I fondly call this the “more breeding mates” measurement. If you select for a lower AGR (more negative), you will have more unrelated options for your potential breedings. This tells us how closely a dog is related to other dogs in our database. The higher it is, the more dogs he is related to. He has an AGR of -.15 which means he is very unrelated to dogs in our database.
Internal Relatedness (IR): And finally, the inbreeding estimate. He has an above average IR value of .08, meaning he is slightly more inbred than the average Italian Greyhound. A high inbreeding measurement would be above .15, according to Dr. Pedersen.
This is the dam. Let’s look at the key points: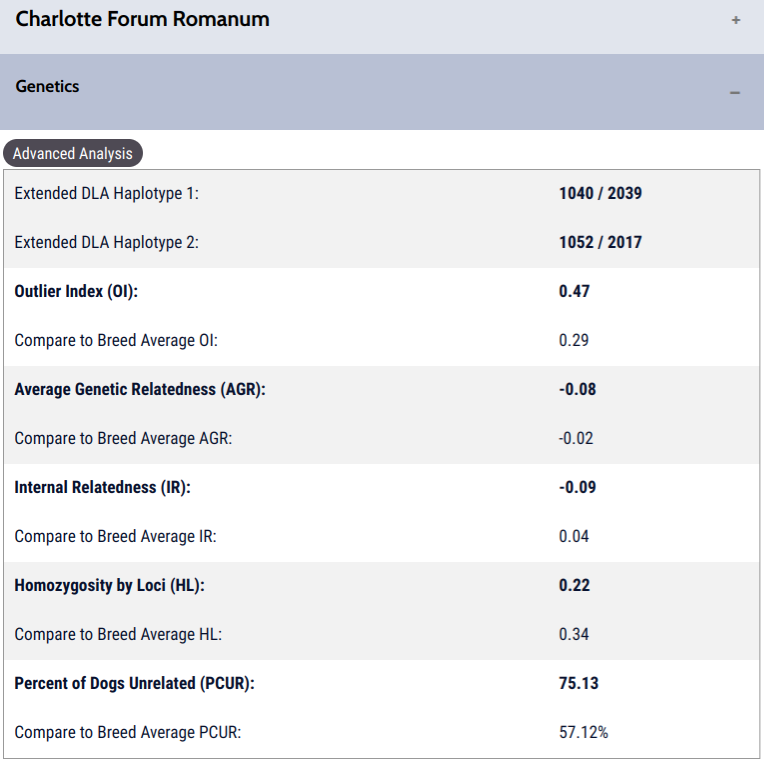
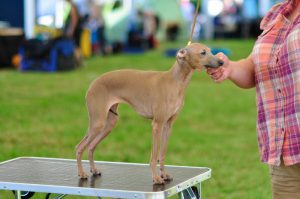
JunWorldWinner`10 EuroSight.JunW`10 WorldClubWinner`12 BDSJG`10 BDSG`12 PLW`10 JunClubW`10 ClubW`11 CIB ACH PLCH HCH CROCH PLJunCH A JunCH H JunCH Charlotte Forum Romanum
The DLA: She has one of the more neutral (but well represented and found in ~10% of the tested alleles) DLA haplotypes and one of the most common DLA haplotypes found in Italian Greyhounds: 1040/2039 and 1052/2017 respectively. These DLA haplotypes are inherited as a unit and will not change from generation to generation.
Italian Greyhounds have retained a remarkable amount of diversity in the DLA, however, there are many that are poorly represented and could be easily lost to genetic drift. According to UC Davis, the most common DLA haplotypes in Class 1 are 1008 (13.49% of the tested alleles), 1044 (24.86% of the tested alleles), and 1052 (19.07% of the tested alleles), and in Class 2 2017 (21.89% of the tested alleles) and 2034 (24.86% of the tested alleles). The rest of the DLA haplotypes are either relatively well distributed or very uncommon.
Outlier Index (OI): Her OI is well above breed average at .47, making her unusual in comparison to the rest of Italian Greyhounds, just like the sire. As this number drops, a breed is breeding toward a genetic bottleneck, or genes that are represented by the majority of a tested population. This can tend to concentrate disease genes as well. The OI of this breed is at a relatively good level and this will be easy to raise in the next generation by breeding her to a dog with higher than breed average OI.
Average Genetic Relatedness (AGR): I fondly call this the “more breeding mates” measurement. If you select for a lower AGR, you will have more unrelated options for your potential breedings. The higher this number, the more dogs she is related to. She has an AGR of -.08, which is lower than breed average. This means she is more unrelated to dogs in the database than the most of the Italian Greyhounds in the database.
Internal Relatedness (IR): And finally, the inbreeding estimate. She has a lower IR value of -.09, which is well below breed average, and means she is outbred. A high inbreeding measurement would be above .15, according to Dr. Pedersen.
So, the next question is, how do they look together?
The Litter Prediction
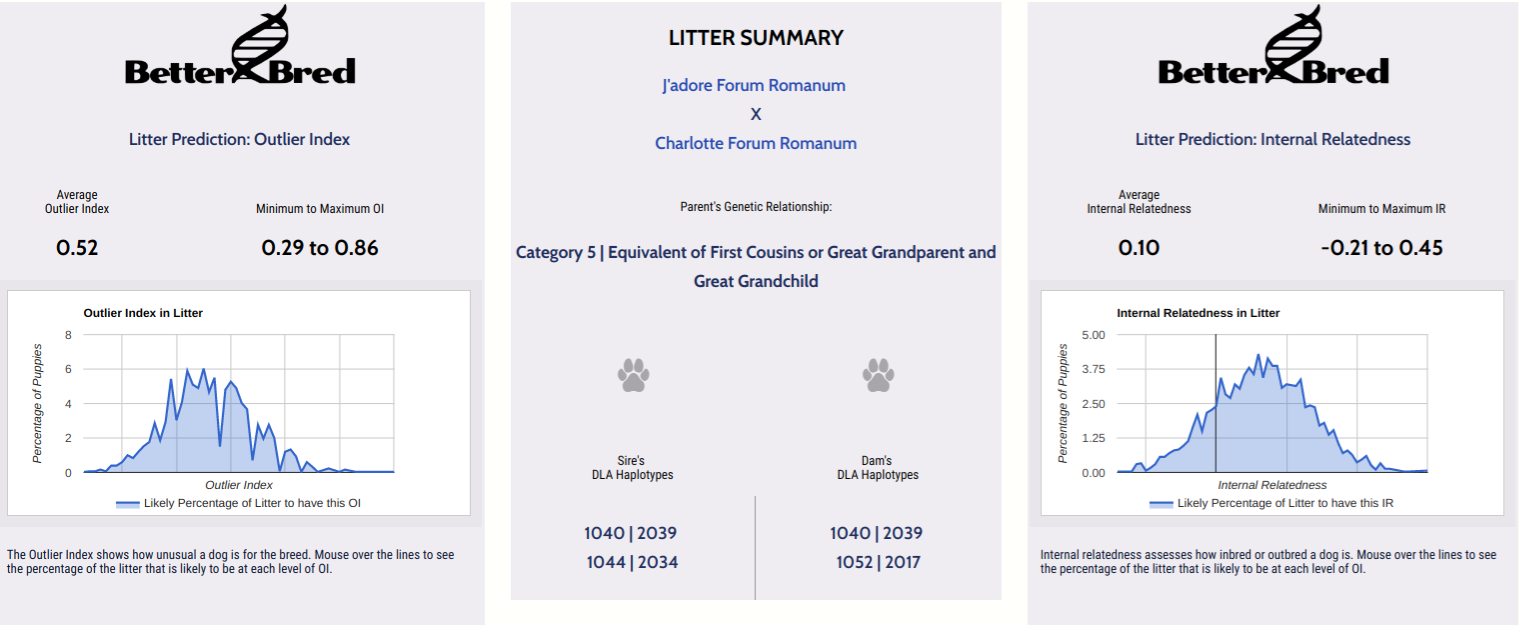
The predicted litter was a category 5 breeding; the COI for the breeding was 8.8% for 7 generations. Relationship categories range from Category 10 (unrelated) all the way to 1 (identical twins.) We generally recommend Category 6 and above, because when you go to the lower categories the level of inbreeding will be much higher, the genetic distance between the potential sire and dam will be tighter, and therefore risks of recessive diseases (or recessive component diseases) expressing are higher. We typically recommend running a test breeding to ensure that the predicted offspring will not have many potential puppies fall above the high threshold for inbreeding, which is generally considered to be around .15 IR. Now, there may be instances that you would breed for a higher IR, especially if your dogs are from a bottlenecked breed and you have a very uncommon dog/bitch. Why? Because those genetics are underrepresented in the population and could be easily lost through genetic drift, so at times a low IR may be sacrificed in order to maintain an unusual line and its less frequent genetics (as long as the line is healthy). This breeding may be one of those examples, as the sire and dam are quite atypical for this population, and it will be easy to bring down the IR in the next generation by breeding to unrelated dogs.
What do you see when you look at this predicted breeding?
The Key Points
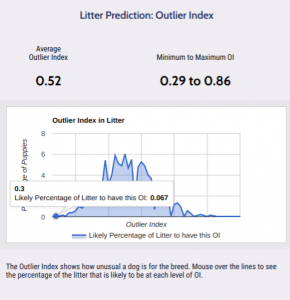 Outlier Index (OI): The predicted range of this litter is .29 to .86, so puppies could fall anywhere from breed average to well above it. The lower this number, the closer one might be breeding toward a potential bottleneck within a breed. The variation in predicted values is because each offspring will receive different genetics from the sire and dam. Each sire and dam has common, neutral, and uncommon genetics in comparison to the rest of the breed. The breed average OI for Italian Greyhounds is .29, which is about in the middle of breed average OIs of all the tested breeds thus far. The average for this breeding is .52, which is well above breed average. The percentage of puppies falling above breed average is very high; you can see in the image to the left that ALL of the litter would fall above .29 which is the breed average for Italian Greyhounds. This is great as it will serve to help represent less common and ne
 utral genetics in this population.
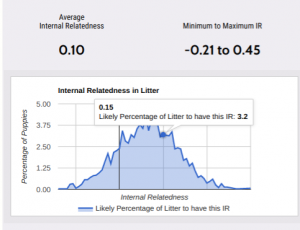
Internal Relatedness (IR): The IR range for this breeding goes from very outbred at -.21 to very inbred at .45. However, when you go to the summary, you can hover over the graph and see just how many will fall in the highly inbred range of .15 to .45. It appears that a good portion of this litter would fall above .15 (I would venture to guess 30%). The average inbreeding of this litter is .1, which is fairly high, all things considered.
DLA: Each puppy from this breeding will have a 75% chance of these puppies will be heterozygous for their DLA haplotype, while 25% of them will be likely to be homozygous for a neutral but well represented DLA haplotype. The study on Italian Greyhounds found that homozygosity in DLA increased risk for autoimmune diseases, so it is good that the majority of this litter would not be homozygous. When all else is equal, in this breeding population I would look for atypical DLA haplotypes and breed for heterozygous DLA. Neither parent carries DLA haplotypes that are very unusual for the tested population.
The Offspring
These are the tested offspring:
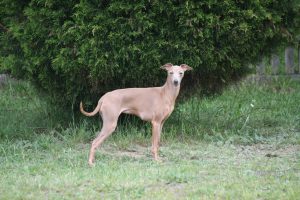
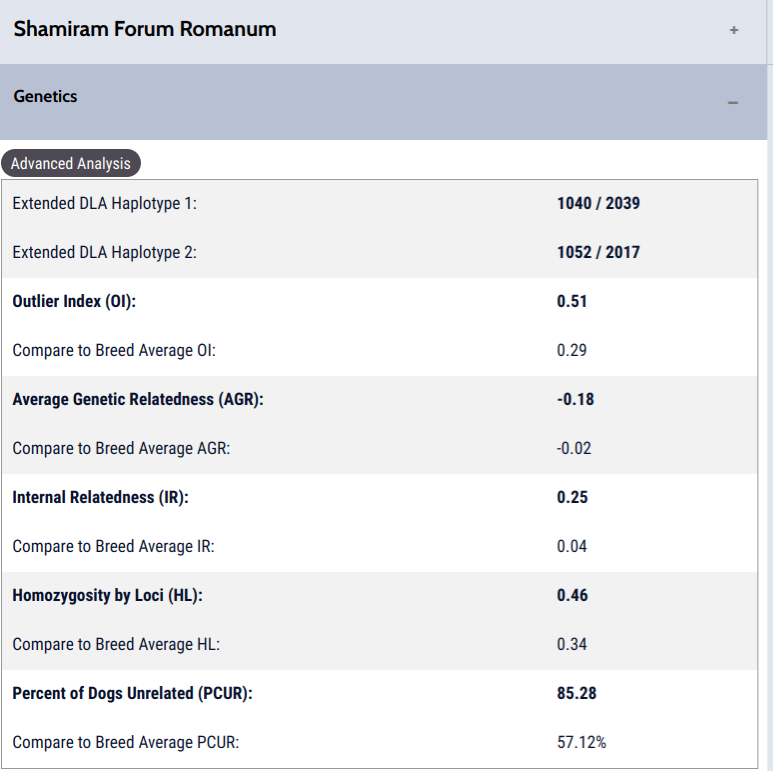 Shamiram Forum Romanum. Let’s look at the key points:
DLA: She received one neutral (but well represented) and one very common DLA haplotype.
Outlier Index (OI): Her OI fell just below the predicted average for this test breeding and was within the predicted litter range; however, her OI is well above breed average. It means her genetics are atypical for the breed, but does not indicate health or quality. This helps breed away from any breed specific bottleneck.
Average Genetic Relatedness (AGR): This is the “unrelated breeding mate” measurement. The lower this number (more negative), the more dogs in the database that are unrelated to her. Her AGR is much lower than breed average, so she will have more unrelated dogs in the current database than is typical for the breed. However, this may change as more of the breeding population is tested and added to the database.
Internal Relatedness (IR): Her IR fell well above breed average, and on the higher end of the predicted litter range at .25. Because her AGR is also so low, she will likely be able to find unrelated mates to continue to produce outbred puppies in the next generation.
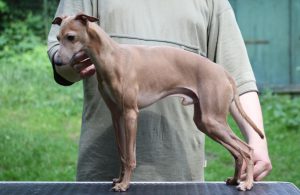
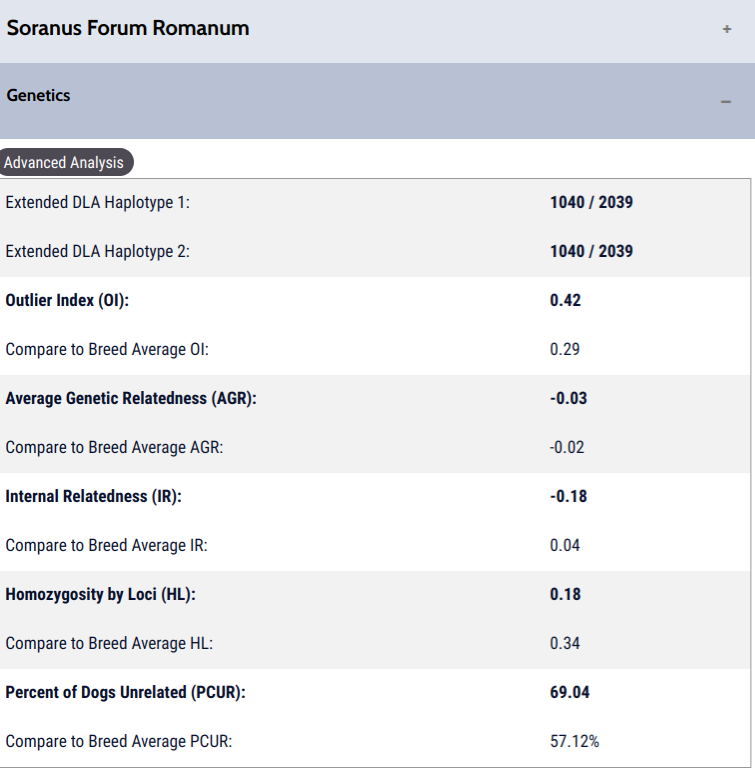 Soranus Forum Romanum. Let’s look at the key points:
DLA: He received two neutral (but well represented) DLA haplotypes.
Outlier Index (OI): His OI fell well below the predicted average for this test breeding, but still well above breed average. This means his genetics are less typical for the breed than the typical Italian Greyhound in the database, but does not indicate health or quality. A higher than breed average OI helps breed away from any breed specific bottleneck.
Average Genetic Relatedness (AGR): This is the “unrelated breeding mate” measurement. The higher this number, the less dogs in the database that are unrelated to your bitch or dog. His is slightly lower than breed average, so he will have slightly more unrelated dogs in the current database than is typical for the breed.
His sister inherited much different genetics than he did, as indicated by her higher OI and much lower AGR.
Internal Relatedness (IR): His IR fell below breed average, and on the lower end of the predicted litter range. He is very outbred, especially compared to his sister.
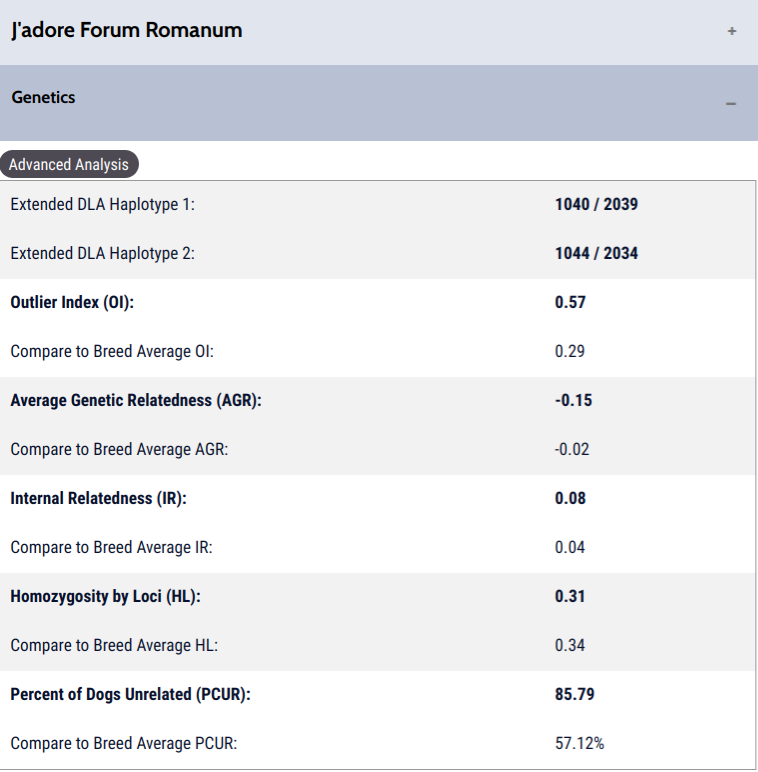
So how might you use this? Say you have tested a full litter (which is not large in Italian Greyhounds). You have two bitches you are considering for your program. One is highly typical for the breed, while the other has less typical genetics with a higher than breed average OI. This would allow you to choose between these two great choices, but also positively impact the breed for the future by breeding away from a potential bottleneck. You could also take a look at available studs around you, and see which might be most unrelated to the puppies you are considering; you might select the puppy least related to a stud you’d like to use in your program, if she and a sibling are comparable in type (of course you will have to watch how she develops whether he will compliment her in the future). This would allow for more outbred puppies in the next generation.
A sincere thank you to the owner/breeder of these dogs for agreeing to allow us to use them in this example!
Conclusion
This breeding predicted puppies with an average IR well above breed average, with a significant portion falling at or above the high range of .15; IR values will be easy to lower in the next generation by breeding to unrelated mates in the database. The OI for the litter was well above breed average, which will help redistribute less typical and neutral genetics within this population should the keepers be used in the future. Both resultant offspring fell well within the predicted values. There can be great ranges in genetics for each litter, and puppies can fall anywhere along those predicted ranges. Often we have seen that entire litters vary drastically from one another, both in inbreeding values as well as outlier index and average genetic relatedness (AGR). The choices we make with each breeding will affect both our puppies and our breed genetics and dynamics in future generations to come; we should be careful to select so that we lose less biodiversity to genetic drift.
Of course breeding is more than just about diversity, as we always need to pair selection for type along with selection for diversity. We cannot have one without the other, as breeding is done by passionate breeders because they love their breed, their lines, and the “family” they have created. BetterBred never suggests breeding for diversity to the exclusion of consideration of pedigree, type, temperament, drive, health etc. This is to add, not detract, from our breeding strategies.
Want to learn more about our BetterBred methods? Take our free mini course for breeders! All you need is a free membership.
 Previous Post
 Next Post