Legacies – Where do offspring fall? Swedish Vallhund
The Swedish Vallhund breed has been found to have very low biodiversity, with an estimated 7% of diversity remaining in comparison to village dogs. As a breed, the existing diversity is fairly well distributed in this sample of Swedish Vallhunds, but this may change as more of the breeding population is tested. At the time of this blog post, 165 Swedish Vallhunds from all around the world have been run at UC Davis.
Breeders should plan litters with IR below breed average to decrease inbreeding and an average OI (outlier index) above the breed average in order to maintain biodiversity and avoid losing existing diversity to genetic drift. What is the outlier index? It’s a measurement on BetterBred that tells you how typical or atypical a dog is in relation to its breed. When the average OI for a breed is high, this means that there isn’t a single specific genetic bottleneck in the breed and that most of the genetics of the breed are not very typical or atypical. These breeds tend to be healthier with less breed specific disease, as long as there is also enough biodiversity within them.
The Parents
Obviously, selection for breeding mates involves more than genetic diversity. We also want the type, temperament, drive, pedigree, robust health etc. in our puppies, just as we always have before. Remember, you can update titles, health testing, photos, and temperament descriptions for your dogs under “my dogs“.
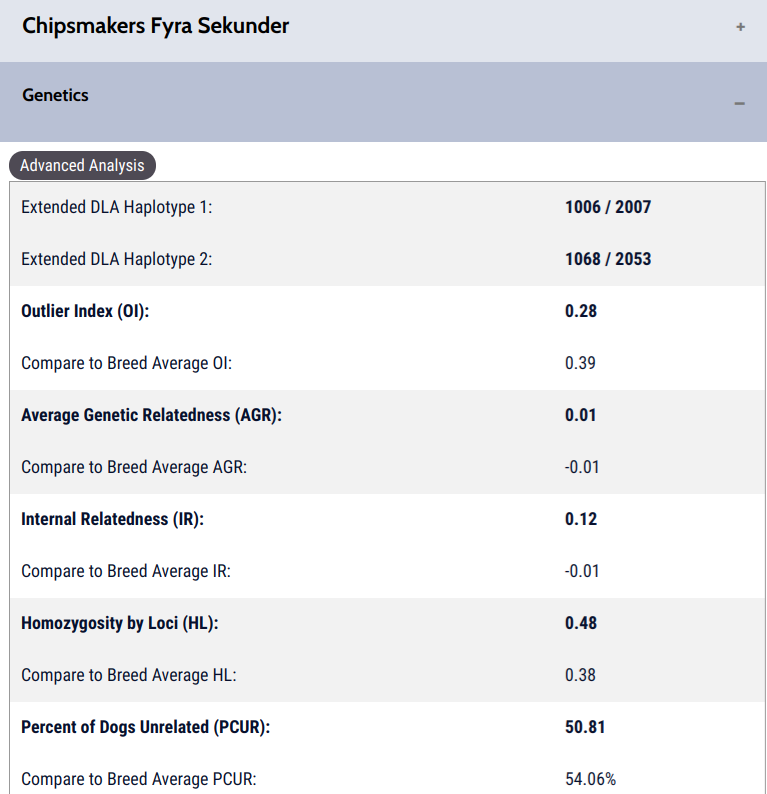 This is the sire. Let’s look at the key points:
The DLA: His DLA (immune system) haplotypes are two of the most well represented in the Swedish Vallhund population thus far tested. 1068/2053 is the most common haplotype combination in this breed. He is heterozygous in his DLA, which is theoretically a benefit to individuals.
The Swedish Vallhund has the lowest diversity in the DLA of any breed yet tested. According to UC Davis, the least well represented DLA haplotypes in this breed are 1009, 1179, and 2022 (represented 5.1%, .9% and 5.1% of the tested haplotypes respectively). The most common DLA haplotypes are 1006, 1068, 2007 and 2053. So, when all else is equal in a breeding, I might opt for a mate with the less well represented haplotypes in order to preserve them in the breed. Once haplotypes disappear from a breed, they can only be restored by an outcross to another breed.
Outlier Index (OI): His OI is below breed average. This means that he has genetics that are more typical for the Swedish Vallhund population that has thus far been sampled. As this number drops, breeders are breeding toward a genetic bottleneck, which is when the genes of a few ancestors become very common in the majority of a population. It’s important to maintain the breed average of this breed so that more genetic diversity at the breedwide level is not lost to drift. The outlier index of this breed might change as more of the breed is sampled.
Average Genetic Relatedness (AGR): I fondly call this the “more breeding mates” measurement. If you select for a lower AGR, you will have more unrelated options for your potential breedings. This tells us how closely a dog is related to other dogs in our database. The higher it is, the more dogs he is related to. He has an AGR of .01 which is slightly higher than breed average. This means he is slightly more related to dogs in the database than the typical Swedish Vallhund in the database.
Internal Relatedness (IR): And finally, the inbreeding estimate. He has an above average IR value, meaning he is more inbred than the average Swedish Vallhund. A high inbreeding measurement would be above .15, according to Dr. Pedersen. This number is easy to lower by breeding to dogs that are unrelated (Category 10 in the BetterBred database).
This is the dam. Let’s look at the key points: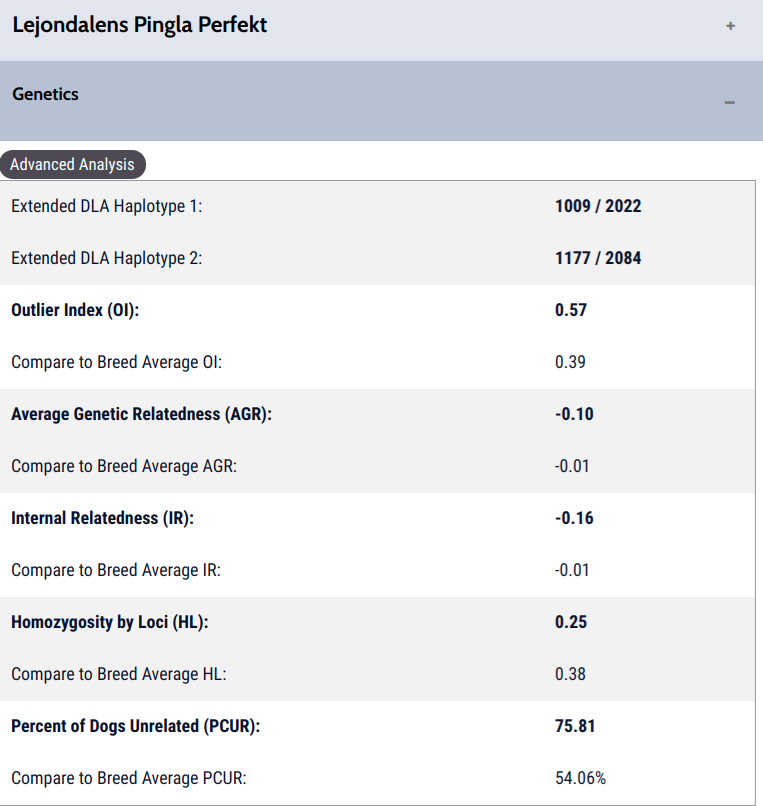
 The DLA: She has the least well represented DLA haplotypes 1009/2022. The other haplotype 1177/2084 is well represented in the population.
According to UC Davis, the least well represented DLA haplotypes in this breed are 1009, 1179, and 2022 (represented 5.1%, .9% and 5.1% of the tested haplotypes respectively). The most common DLA haplotypes are 1006, 1068, 2007 and 2053. So, when all else is equal in a breeding, I might opt for a mate with the less well represented haplotypes in order to preserve them in the breed. Once haplotypes disappear from a breed, they can only be restored by an outcross to another breed.
Outlier Index (OI): Her OI is a well above breed average. This means that her genetics are less well represented in this tested population of Swedish Vallhunds. As this number drops, a breed is breeding toward a genetic bottleneck, or genes that are represented by the majority of a tested population. This can tend to concentrate disease genes as well.
Average Genetic Relatedness (AGR): I fondly call this the “more breeding mates” measurement. If you select for a lower AGR, you will have more unrelated options for your potential breedings. The higher this number, the more dogs she is related to. She has an AGR of -.10, which is much lower than breed average. This means she is more unrelated to other Swedish Vallhunds in the database than is typical for the average Swedish Vallhund and is another indication that she is atypical in comparison to this tested population. This may change as more of the population is sampled.
Internal Relatedness (IR): And finally, the inbreeding estimate. She has a low IR value, which means she is outbred. A high inbreeding measurement would be above .15, according to Dr. Pedersen.
So, the next question is, how do they look together?
The Litter Prediction
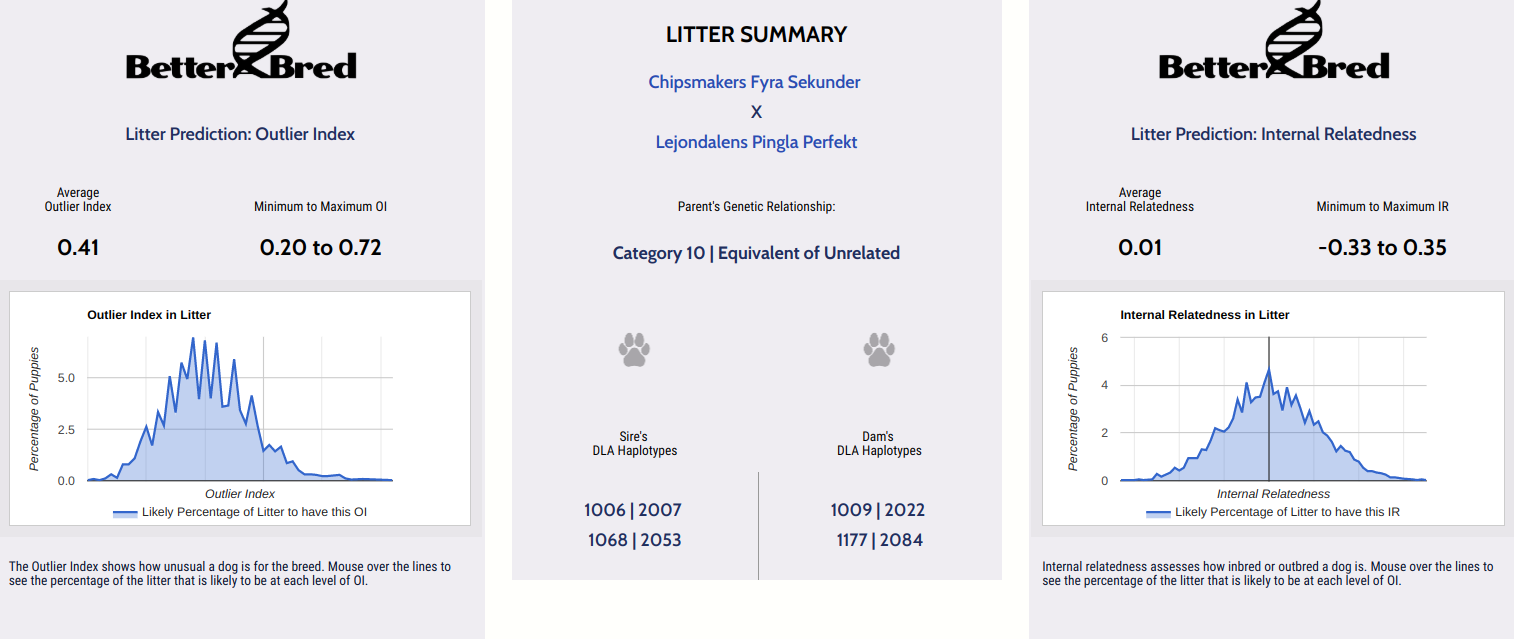
The predicted litter was a category 10 breeding. The categories on BetterBred tell us how closely related dogs are to one another and range from category 10 (unrelated) all the way to 1 (identical twins). We generally recommend Category 6 and above (ideally 10!), because when you go to the lower categories the level of inbreeding will be much higher, the genetic distance between the potential sire and dam will be tighter, and therefore risks of recessive diseases are higher. We typically recommend running a test breeding to ensure that the predicted offspring will not have many potential puppies fall above the high threshold for inbreeding, which is generally considered to be around .15 IR. Now, there may be instances that you would breed for a higher IR, especially if your dogs are from a bottlenecked breed and you have a very uncommon dog/bitch. Why? Because those genetics are underrepresented in the population and could be easily lost through genetic drift, so at times a low IR may be sacrificed in order to maintain an unusual line and its less frequent genetics (as long as the line is healthy). In this breed, while the genetics are well distributed in the tested population, it is lacking in biodiversity. As a result, it’s vital to maintain what they have in the population. Breeders should try to select for higher category breedings while keeping an eye on the breed average outlier index. This can be done by keeping individual litter average OI at or above breed average, while striving to breed as unrelated dogs together as possible while selecting for health and breed type.
What do you see when you look at this predicted breeding?
The Key Points
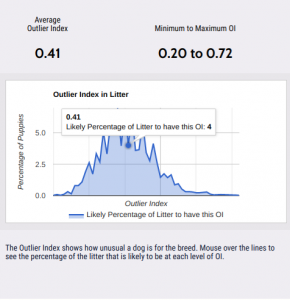 Outlier Index (OI): The predicted range of this litter is .20 to .72, so puppies could fall anywhere from far below breed average to well above it. The lower this number, the closer one might be breeding toward a potential bottleneck within a breed. The variation in predicted OI is because each offspring will receive different genetics from the sire and dam. Each sire and dam has common, average, and uncommon genetics in comparison to the rest of the breed. The breed average OI for Swedish Vallhunds is .39, which compared to other breeds means the genetics they have are fairly well distributed. The average for this breeding is .41, which is above breed average. The percentage of puppies falling above breed average is very high; you can see in the image to the left that it appears about half of the litter would fall above the breed average for Swedish Vallhunds. This is great as it will serve to help redistribute less common genetics in this population.
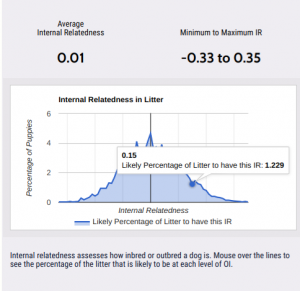
Internal Relatedness (IR): The IR range for this breeding goes from very outbred at -.33 to very inbred at .35. However, when you go to the summary, you can hover over the graph and see just how many will fall in the highly inbred range of .15 to .30. It appears that a perhaps 1/5th of this litter would fall above .15. Why would this be with a Category 10 breeding? This gene pool is much smaller than other breeds, so even dogs that are the most unrelated for this population will likely have some genetics in common. We typically recommend litter average at or below 0.
DLA: 100% of the puppies from this breeding will be heterozygous, and half of them should receive the least common haplotype combination of 1009/2022.
The Offspring
These are two of the tested offspring:
Chipsmakers Lilla Vackra Anna – Let’s look at the key points: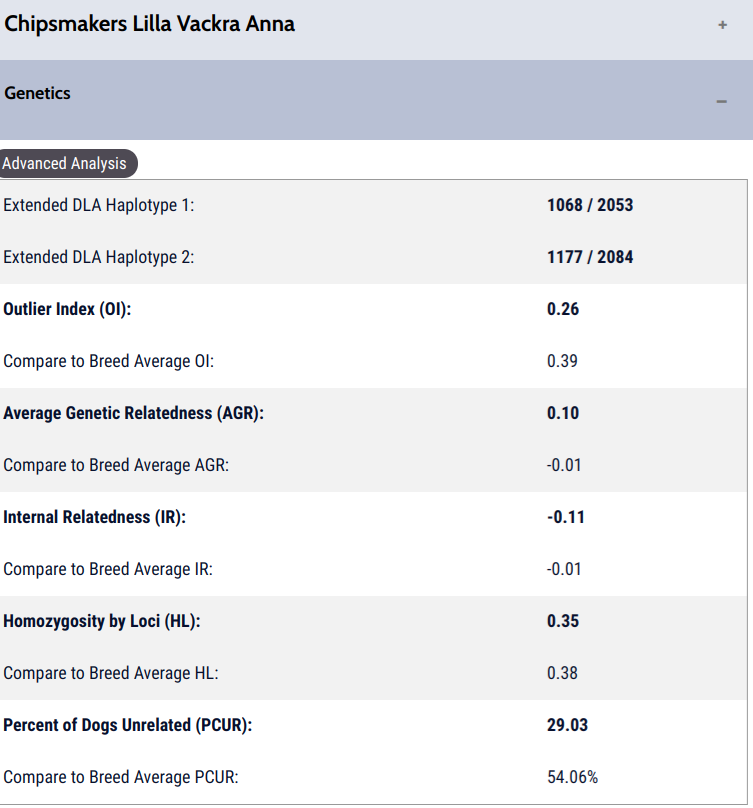
DLA: Anna received the most common DLA haplotype 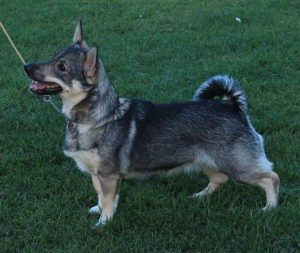 1068/2053 from her sire and the haplotype that is well distributed 1177/2084 from her dam.
Outlier Index (OI): Her OI fell below the predicted average for this test breeding, but was within the predicted litter range. This means that the genetics she has are commonly represented in this tested population; however, a low OI does not indicate health or quality. This will be easy to raise in the next generation by breeding to a stud with higher than breed average OI.
Average Genetic Relatedness (AGR): This is the “unrelated breeding mate” measurement. Her AGR is higher than breed average, so she will have less unrelated dogs in the current database than is typical for the breed. However, this may change as more of the breeding population is tested that are unrelated from this particular line.
Internal Relatedness (IR): Her IR fell well below breed average and the average for the predicted litter range. Because her AGR is also so high, she will have more difficulty finding unrelated mates in the database to breed to that produce outbred puppies in the next generation.
Notice in the next tested offspring how different the two are from one another in OI, AGR and IR!
Chipsmakers Lilla Stjarna
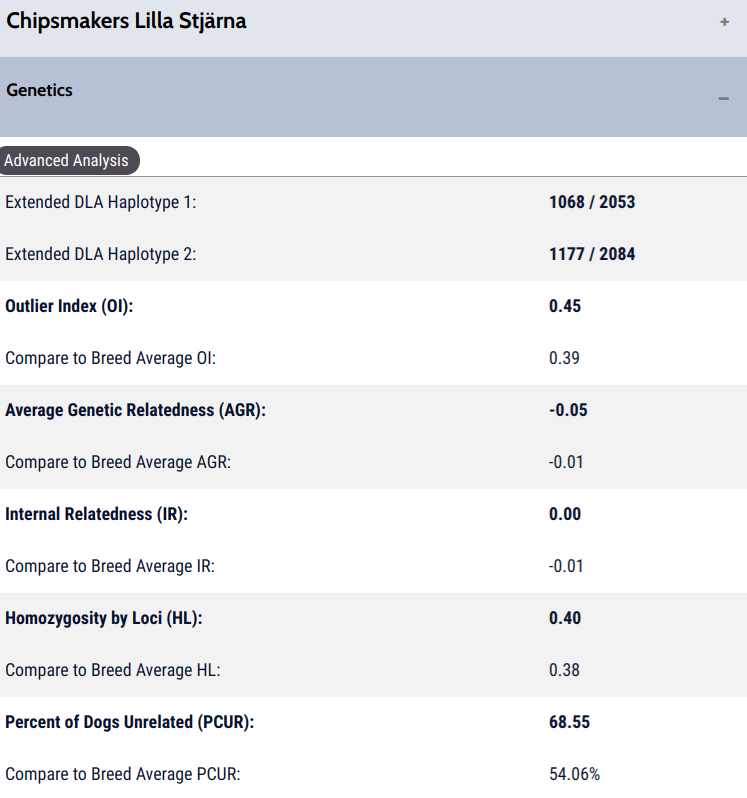 DLA: She received the most common DLA haplotype 1068/2053
  from her sire and the haplotype that is well distributed 1177/2084 from her dam.
Outlier Index (OI): Her OI fell above the predicted average for this test breeding, which was within the predicted litter range. It means her genetics are less typical for the breed than the typical Swedish Vallhund in the database, but does not indicate health or quality. This helps breed away from any breed specific bottleneck and maintain biodiversity at the breedwide level.
Average Genetic Relatedness (AGR): This is the “unrelated breeding mate” measurement. The higher this is the less dogs in the database are unrelated to your bitch or dog. Her AGR is lower than breed average, so she will have more unrelated dogs in the current database than is typical for the breed. However, this may change as more of the breeding population is tested.
Internal Relatedness (IR): Her IR fell slightly above breed average, and pretty much right at average for the predicted litter range. Because her AGR is also so low, she will likely be able to find unrelated mates to continue to produce outbred puppies in the next generation.
So, how might you use this? Say you have tested a full litter. You have two bitches you are considering for your program. One is highly typical for the breed, while the other has less typical genetics with a higher than breed average OI. This would allow you to choose between these two great choices, but also positively impact the breed for the future by breeding away from a potential bottleneck and for maintenance of biodiversity, which is vital in this population. You could also look at potential breeding mates for each female in the future. These could be males you might like to consider if they compliment your bitch in type, temperament, drive, pedigree (etc) once she matures. This would allow you to see which might look the best with which bitch.
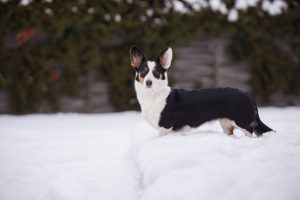
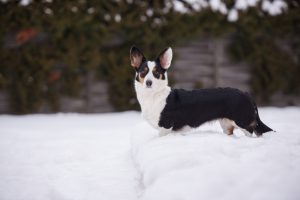
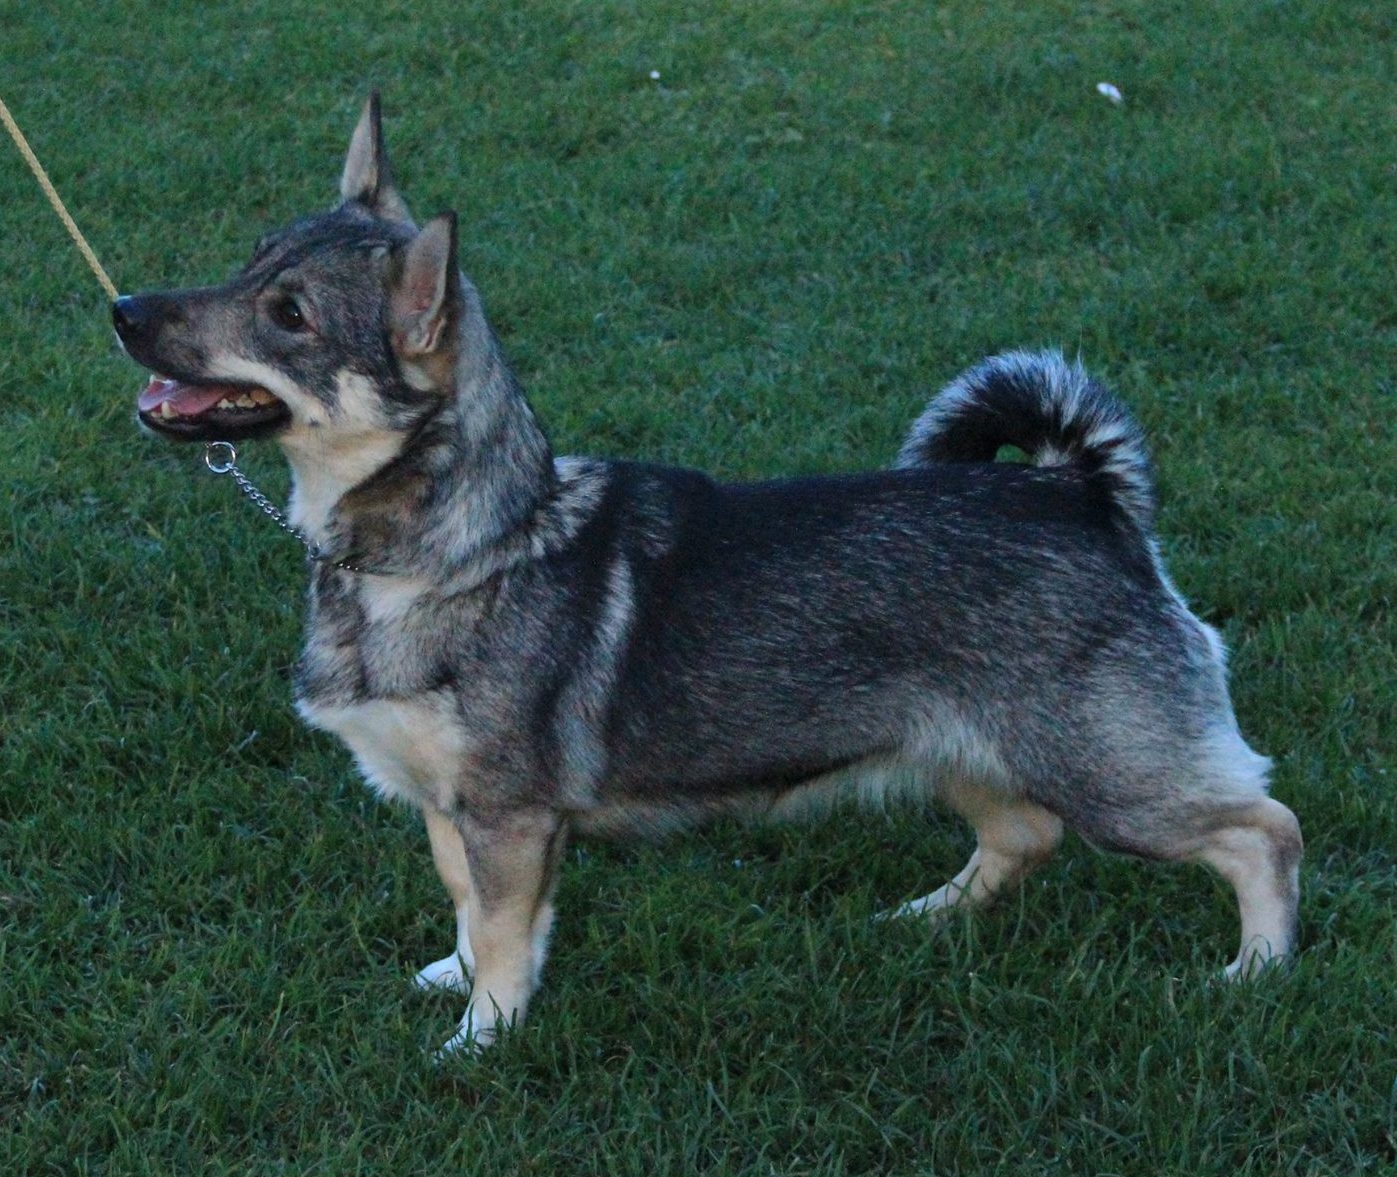
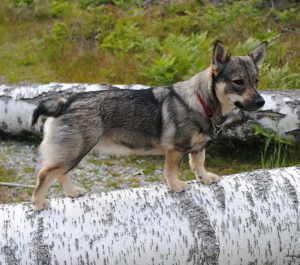
Anna is pictured as the feature photo for this blog post. Thank you to the owners of these dogs for allowing us to use them in this demonstration!
Conclusion
This breeding predicted puppies with an average IR around breed average, with a portion falling at the high range of .15. The OI for the litter was well above breed average, which will help redistribute less typical and neutral genetics within this tested population. The resultant offspring fell well within the predicted values, one with less atypical genetics and the other with more typical genetics for this tested population of Swedish Vallhunds. There can be great ranges in genetics for each litter, and puppies can fall anywhere along those predicted ranges. Often we have seen that entire litters vary drastically from one another, both in inbreeding values as well as outlier index and average genetic relatedness (AGR) as seen in this example. The choices we make with each breeding will affect our breed genetics and dynamics in future generations to come; we should be careful to select so that we lose less biodiversity to genetic drift.
Of course breeding is more than just about diversity, as we always need to pair selection for type along with selection for diversity. We cannot have one without the other, as breeding is done by passionate breeders because they love their breed, their lines, and the “family” they have created. BetterBred never suggests breeding for diversity to the exclusion of consideration of pedigree, type, temperament, drive, health etc. This is to add, not detract, from our breeding strategies.
 Previous Post
 Next Post